Introduction
Collecting and visualizing data is an important way to make informed decisions about your servers and projects.
In a previous guide, we discussed how to install and configure Graphite to visualize data on our servers. However, we didn’t have a good way of collecting or even passing data into Graphite.
In this guide, we’ll discuss the installation and use of collectd, a system statistics gatherer that can collect and organize metrics about your server and running services.
We will show you how to install and configure collectd to pass data into Graphite to render. We will assume that you have Graphite up and running on an Ubuntu 14.04 server as we showed you in the last guide.
Grafana 是 Graphite仪表盘和图形编辑器。Grafana 是开源的、功能齐全的度量仪表盘和图形编辑器,支持 Graphite,InfluxDB 和 OpenTSDB。
Grafana 主要特性:
- 灵活丰富的图形化选项;
- 可以混合多种风格;
- 支持白天和夜间模式;
- 多个数据源;
- Graphite 和 InfluxDB 查询编辑器等等。
Graphite是一款企业级的监控工具,其采用Django框架,可以运行在廉价的硬件资源之上。Graphite采用简单的文本协议和绘图功能可以方便地使用在任何操作系统上。本文将以Ubuntu 14.04为系统环境,就Graphite与Grafana的安装与协作做详细介绍。
Before You Begin / 热身准备
1. Familiarize yourself with our Getting Started guide and complete the steps for setting your Linode’s hostname and timezone.
本文原文来自Linode官网,所以会看到Linode字样,不用理会,把它当成你的主机的就可以了
Add DNS record
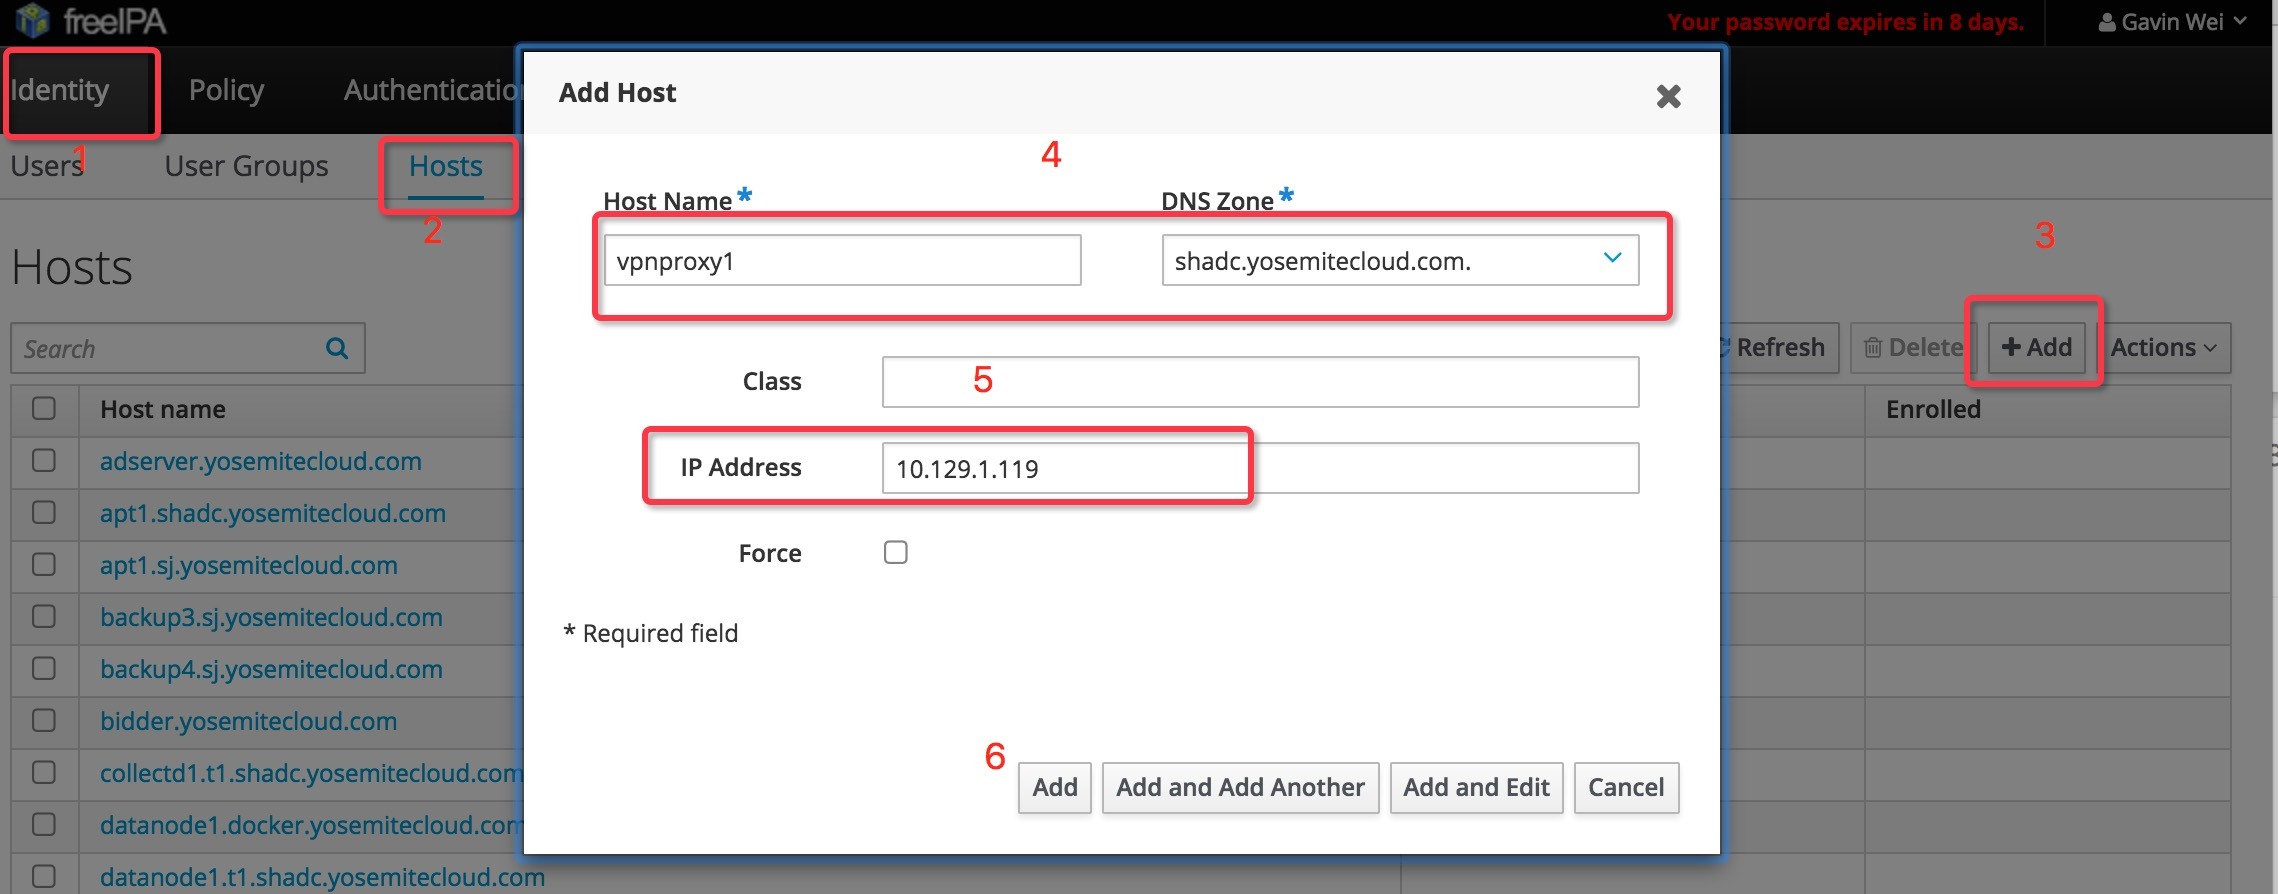
Firstly, we need ceate a host(DNS recore) for our container vpnproxy
Login https://ipa-ja-1.example.com
add a host as the following picture shows:
Identity –> Hosts –> Add :
By now, we’ve created a DNS recore, map vpnproxy1.shadc.example.com to IP 10.129.1.119
